One of the most common questions educators ask about the flashcard app Brainscape is: “How can I show that this actually improves learning outcomes?”
It is a fair question! Schools, administrators, and training managers increasingly want evidence that the tools being used in classrooms or training programs are making a measurable difference.
At the same time, Brainscape is not an assessment platform. Students rate how well they know each concept as they study (which in turn powers Brainscape's spaced repetition engine). In other words, those ratings are useful for learning but are not strong enough to stand alone as proof of mastery.
So, how can you show the impact of Brainscape?
There are three ways to approach building that case and these are best done together:
- Start with understanding and teaching the cognitive science behind spaced retrieval and active recall.
- Compare Brainscape study data with assessment results to look for patterns in your own class.
- Use study metrics and classroom observations together to spot changes in consistency, confidence, and performance.
Approach #1: Teach the Cognitive Science Behind Spaced Retrieval
Let’s start with the research behind the platform itself.
Brainscape is built around well-established principles from cognitive psychology, including:

These strategies are supported by a large body of research and are widely regarded as some of the most effective ways to improve long-term retention.
So, Brainscape is not based on a speculative theory about learning. It is a structured way of applying methods that are already strongly supported by the cognitive science of studying.
That gives educators a solid theoretical basis for using it. That said, you probably want to go a step further with some real classroom data, which brings us to the next (additional) approach...
Approach #2: Correlate Study Data with Exam Scores
Let’s begin by saying that running scientifically accurate experiments with human students can be pretty tricky. Humans are notoriously difficult to control... and are prone to all kinds of cognitive biases. Comparing one semester to the next is not especially clean either, because every cohort is different.
A more practical option, however, is to use your own classroom data as a natural experiment.
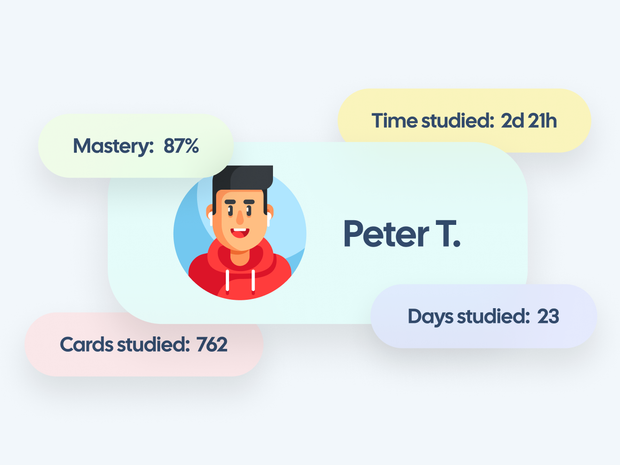
In Brainscape, open the Learners tab for your class (or your Partner Report dashboard if your institution has a school or enterprise license) and export the learner analytics to a spreadsheet.
That export will usually include data such as:
- Mastery
- Number of study days
- Total study time
- Total cards studied

Of those metrics, the number of study days is often the most revealing. It shows whether students are spacing their studying across multiple days rather than trying to cram everything into one or two long sessions.
(Read: 'How to Get Your Students to Study Regularly & Stop Cramming')
That matters because spaced study is one of the strongest predictors of durable learning. A student who studies for six short sessions across two weeks is usually building a far stronger habit, and often a stronger outcome, than a student who logs the same total time in one marathon sitting.
In other words, total study time tells you how much work was done. The number of study days tells you how the work was distributed. And in many cases, that distribution is the more meaningful signal.
Then, in your spreadsheet, add another column for each student’s quiz scores, test scores, or other assessment results.
Once both sets of information are in one place, you can start exercising your spreadsheet skills and looking for patterns. In many classrooms, a clear relationship begins to emerge: students who spend more time studying flashcards and who spread their studying across more days, typically perform better on assessments.
You do not need advanced statistical training to spot this. Even a basic scatter plot in Excel or Google Sheets can help you see whether stronger study habits are lining up with stronger results. (You could even drop your data file in ChatGPT or Gemini and ask it to discuss any statistically significant patterns it picks up on.)
That kind of classroom-based evidence can be very persuasive when an administrator asks whether Brainscape is working. Plus, it allows you to identify struggling students early and get them back on track!
Try a Before-and-After Comparison
Another simple way to prove learning outcomes with Brainscape is to compare class performance before and after it becomes part of their study routine.
For example, you might look at average quiz scores, test scores, or pass rates from a period before introducing Brainscape, then compare them with results from a later period, such as three months after students began using it regularly.
This kind of before-and-after snapshot is not a perfect scientific study, but it can still be a very clear and practical way to show whether the addition of Brainscape appears to be strengthening performance.
Of course, this comparison is only useful if students are actually using Brainscape consistently. That is where the study analytics matter.
If the data shows that students are returning across multiple study days, putting in meaningful review time, and using the platform in the intended way, then any improvement in scores would appear to be the result of this smart learning tool!
Remember though: Brainscape can only improve outcomes if students are truly using it, and using it well.
(Read: 'How to Make Flashcards Students Will Actually Want to Study')
Turn Your Results Into a Case Study
If you run this kind of comparison and find a clear relationship between Brainscape study habits and assessment performance, document what you found!
It could be as simple as an internal report, a short departmental presentation, or a case study shared during professional development.
And if your results are especially strong, Brainscape would genuinely love to hear about them. (You can email us at info@brainscape.com.) Educator case studies help show how retrieval-based study systems can improve outcomes across different subjects and teaching contexts.
Help Students Use Their Own Study Stats as Motivation
Not every useful Brainscape metric is meant for the teacher dashboard. Some of the most motivating data lives on the learner’s own stats screen!

As explain in this helpful guide on how to use our study data for motivation, visible progress can do for studying what fitness trackers do for exercise. It makes an invisible habit easier to notice, manage, and improve.
Students can track things like:
- Total time studied
- Cards reviewed
- Study streaks
- Mastery progress
That visibility can be enough to actually change behaviour. When students can see their progress building over time, they are more likely to keep going. When they notice their activity dropping off, they'll want to get back on track more quickly.
For teachers, this matters because better learning outcomes do not come only from what students know in a given moment. They also depend on whether students are studying consistently enough for learning to stick in the long-term.
So, actively encourage students to check their own stats screen often, so that they start taking ownership of the study habits that lead to better results!
(Read: 'How to Formally Grade Students on Their Use of Brainscape')
Approach #3: Make Real Classroom Observations: What Patterns Do You Notice?
In practice, teachers often notice a few familiar patterns when Brainscape becomes part of the study routine.
Students who study flashcards consistently tend to:
- Recall foundational knowledge more quickly
- Participate more confidently in discussions
- Require less last-minute cramming
- Perform more reliably on cumulative assessments
On the other hand, students who rarely use the platform often continue to struggle with the same underlying concepts. So, pay attention to your class. Who's actively participating and making progress? Who seems to be stuck?
You'll probably discover the underlying cause in their learner metrics.
Brainscape's analytics make these patterns easier to spot, before the final exam rolls around. That gives teachers a way to connect study behavior with what is happening in class... and do something about it before it has a chance to damage learning.
Proving learning outcomes with Brainscape does not require a complicated research design. You already have useful data. All you need to do is connect the dots between study habits and student performance, which is exactly what we've shown you how to do in this article!
Get Brainscape's Educator User Guide
Curious to learn more about how to introduce Brainscape into your physical or virtual classroom? Our Educator User Guide provides a detailed walkthrough of how to get set up. It'll also give you all the material you need to motivate for its adoption amongst your students, their parents, and/or the faculty of your school or college:

Other Free Educator Resources:
- Brainscape Teacher’s Academy: Practical guides for implementing the cognitive science of learning and memory into your classroom, at scale
- “Tips for Teachers” YouTube Channel: Short, research-backed advice and classroom strategies
- The Educator Community: Join the conversation, ask questions about Brainscape, read other educators’ insights, and log your feature requests here!