The Solow growth model describes:
- how output is determined at a point in time.
- how output is determined with fixed amounts of capital and labor.
- how saving, population growth, and technological change affect output over time.
- the static allocation, production, and distribution of the economy’s output.
3
Unlike the long-run classical model in Chapter 3, the Solow growth model:
- assumes that the factors of production and technology are the sources of the economy’s output.
- describes changes in the economy over time.
- is static.
- assumes that the supply of goods determines how much output is produced.
describes changes in the economy over time.
In the Solow growth model, the assumption of constant returns to scale means that:
- all economies have the same amount of capital per worker.
- the steady-state level of output is constant regardless of the number of workers.
- the saving rate equals the constant rate of depreciation.
- the number of workers in an economy does not affect the relationship between output per worker and capital per worker.
the number of workers in an economy does not affect the relationship between output per worker and capital per worker.
The production function y = f(k) means:
- labor is not a factor of production.
- output per worker is a function of labor productivity.
- output per worker is a function of capital per worker.
- the production function exhibits increasing returns to scale.
output per worker is a function of capital per worker.
When f(k) is drawn on a graph with increases in k noted along the horizontal axis, the:
- graph is a straight line.
- slope of the line eventually gets flatter and flatter.
- slope of the line eventually becomes negative.
- slope of the line eventually becomes steeper and steeper
slope of the line eventually gets flatter and flatter.
Two economies are identical except that the level of capital per worker is higher in Highland than in Lowland. The production functions in both economies exhibit diminishing marginal product of capital. An extra unit of capital per worker increases output per worker:
- more in Highland.
- more in Lowland.
- by the same amount in Highland and Lowland.
- in Highland, but not in Lowland.
more in Lowland.
The consumption function in the Solow model assumes that society saves a:
- constant proportion of income.
- smaller proportion of income as it becomes richer.
- larger proportion of income as it becomes richer.
- larger proportion of income when the interest rate is higher.
constant proportion of income.
In the Solow growth model of Chapter 8, the demand for goods equals investment:
- minus depreciation.
- plus saving.
- plus consumption.
- plus depreciation.
plus consumption.
In the Solow growth model of Chapter 8, where s is the saving rate, y is output per worker, and i is investment per worker, consumption per worker (c) equals:
- sy
- (1 – s)y
- (1 + s)y
- (1 – s)y – i
(1 – s)y
In the Solow growth model of Chapter 8, investment equals:
- output.
- consumption.
- the marginal product of capital.
- saving.
saving.
In the Solow growth model of Chapter 8, for any given capital stock, the ______ determines how much output the economy produces and the ______ determines the allocation of output between consumption and investment.
- saving rate; production function
- depreciation rate; population growth rate
- production function; saving rate
- population growth rate; saving rate
production function; saving rate
In the Solow growth model the saving rate determines the allocation of output between:
- saving and investment.
- output and capital.
- consumption and output.
- investment and consumption
investment and consumption.
______ cause(s) the capital stock to rise, while ______ cause(s) the capital stock to fall.
- Inflation; deflation
- Interest rates; the discount rate
- Investment; depreciation
- International trade; depressions
Investment; depreciation
Investment per worker (i) as a function of the saving ratio (s) and output per worker (f(k)) may be expressed as:
- s + f(k).
- s – f(k).
- sf(k).
- s/f(k).
sf(k).
When f(k) is drawn on a graph with increases in k noted along the horizontal axis, the slope of the line denotes:
- output per worker.
- output per unit of capital.
- the marginal product of labor.
- the marginal product of capital.
the marginal product of capital.
In this graph, when the capital–labor ratio is OA, AB represents:
- investment per worker, and AC represents consumption per worker.
- consumption per worker, and AC represents investment per worker.
- investment per worker, and BC represents consumption per worker.
- consumption per worker, and BC represents investment per worker.
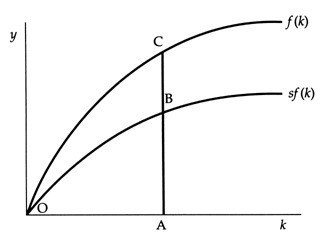
investment per worker, and BC represents consumption per worker.
If the capital stock equals 200 units in year 1 and the depreciation rate is 5 percent per year, then in year 2, assuming no new or replacement investment, the capital stock would equal _____ units.
- 210
- 200
- 195
- 190
190
In the Solow model, it is assumed that a(n) ______ fraction of capital wears out as the capital–labor ratio increases.
- smaller
- larger
- constant
- increasing
constant
The change in capital stock per worker (∆k) may be expressed as a function of s = the saving ratio, f(k) = output per worker, k = capital per worker, and δ = the depreciation rate, by the equation:
- ∆k = sf(k)/δk.
- ∆k = sf(k) × δk.
- ∆k = sf(k) + δk.
- ∆k = sf(k) – δk.
∆k = sf(k) – δk.
The steady-state level of capital occurs when the change in the capital stock (∆k) equals:
- 0.
- the saving rate.
- the depreciation rate.
- the population growth rate.
0.
In the steady state with no population growth or technological change, the capital stock does not change because investment equals:
- output per worker.
- the marginal product of capital.
- depreciation.
- consumption.
depreciation.
In the Solow growth model of Chapter 8, the economy ends up with a steady-state level of capital:
- only if it starts from a level of capital below the steady-state level.
- only if it starts from a level of capital above the steady-state level.
- only if it starts from a steady-state level of capital.
- regardless of the starting level of capital.
regardless of the starting level of capital.
In the Solow growth model, the steady-state occurs when:
- capital per worker is constant.
- the saving rate equals the depreciation rate.
- output per worker equals consumption per worker.
- consumption per worker is maximized.
capital per worker is constant.
In this graph, capital–labor ratio k is not the steady-state capital–labor ratio because:
- the saving rate is too high.
- the investment ratio is too high.
- gross investment is greater than depreciation.
- depreciation is greater than gross investment.
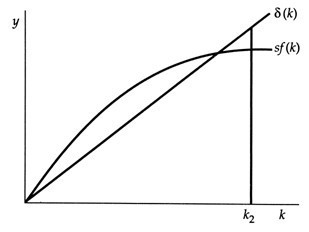
depreciation is greater than gross investment.


