when did lenarde create method of least squares
1805
when did gauss use method of least squares
1809
when did sir galton coin ‘REGRESSION’
1822-1911?? how long he lived
when was George Yule’s joined distrubution assumed to be Gaussian
1851-1952
when was Karl pearson’s joined distribution assumed to be Gaussian
1857-1936
when did sir ronald fisher weaken the assumption of yule and pearson
1980-1962
what ‘s the earliest form of regression
method of least squares by
- LEGENDRE 1805
- GAUSS 1809
used for astronomic observations - orbits of comets and minor planets around the sun
what did gauss do in 1821
Gauss published a further development of the theory of least squares, including a
version of the Gauss–Markov theorem
what did Francis galton do in 1890
the term “regression” was coined by Francis Galton to describe a biological phenomenon which was
‘heights of descendants of tall ancestors tend to
regress down towards a normal average’
when did Udny Yule and Karl Pearson extend Galton’s work in
1897-1903
Galton’s work was later extended by Udny Yule and
Karl Pearson to a more general statistical context.
In the work of Yule and Pearson, the joint
distribution of the response and explanatory
variables is assumed to be Gaussian.
when did R.A. fisher weaken pearson and yule
1922-1925
- his assumption is simular to Gauss’s in 1821
- he states that ‘conditional distribution of the response
variable is Gaussian, but the joint distribution need not
be’
when did Economists use electromechanical desk calculators to calculate regressions.
1950s-1960s
before what date did it take up to 24 hours to
receive the result from one regression
before 1970
types of statistical modelling
deterministic and probabilistic models
types of probabilistic models
- regression models
- correlation models
- othe models
types of regression modells
- simple: 1 explanatory variable
- linear or non-linear
- multiple: 2+ explanatory variables
- linear or non linear
what is regression analysis
the nature and strength of of the relationship betw/ variables can be examined by regression and correlation analysis
regression:
assessment of the specific forms of the relationship between variablles in order to predict/estimate the value of one variable corresponding to a given value of another variable.
7 steps of regression modelling
- Define the problem or question
- Specify model
- Collect data
- Do descriptive data analysis
- Estimate unknown parameters
- Evaluate model
- Use model for prediction
simple vs mx regression analyis
simple
- 𝛽 is the unit change in Y per unit change in X
- doesn’t take into account any other variable besides the single independent variable
multiple
- 𝛽𝑖 is the unit change in Y per unit change in Xi
- takes into account the effect of other 𝛽𝑖s
- it is the net regression coefficient
6 assumptions required for regression analysis
- CONTINUOUS V: the two variables should be either interval or ratio variables
- LINEARITY: the Y variable is linearly related to the value of the X variable
- INDEPENDENCE OF ERROR: the residual error is independent for each value of x
- NO SIGNIFICANT OUTLIERS: outliers can have a negative effect on the analyisis
- HOMO-SCEDASTICITY: the variation around the line of regression is constant for all values of X (random errors have a constant variance)
- NORMALITY: the values of Y be normally distributed at each value of X
what is the goal of regression analysis
to be a statistical model that can predict values of a dependant(response) variable based on the values of the independent (expanatory) variable
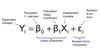
what is SİMPLE LİNEAR REGRESSİON
describes the linear relationship between a predictor/independant variable, plotted on the x-axis, and a response/ dependant variable, plotted on the y-axis
what is the simplest model of the relationship
between two interval-scaled attributes,Straight line
a Straight line=
- it’s slope shows the existence of an association between them.
- thus an objective way to investigate an association betw interval attributes is to draw a
straight line through the center of the cloud of points and measure its slope.
*
what if the slope is 0
line is horizontal and we conclude that there is no association.
non zero= association