Chapter 6: Correlation and Predicted Variance Flashcards
(30 cards)
Relationships in statistics are looked at for what three reasons?
- comparison of different distributions - determining causality - psychometric properties of questionnaires
Correlations? (4)
- interested in relationship not magnitude of one over the other.. - one variable carries information about another variable - easy first step in determining causality but there has to be a correlation - Correlations do not = CAUSATION. ever.
When constructing a scatter what is being graphed?
X and Y data points….
Linear relationships? What the heck are they?
- straight line…what we are interested in!
Curve relationship?
- not interested in this - BAD…..they are bias..
Describe a positive relationship?
- each variable is increasing together - correlation is evident - direct
Describe a negative relationship?
- one variable is increasing while the other is decreasing… -inverse
Describe a perfect relationship ? Are they common?
- all data points fall exactly on the line - not very common
Describe an imperfect relationship? Are they common?
- all data points do not fall on the line - still linear -very common -line of best fit/ regression line L> basically a mean….points around it = variance…
Correlation part 2 yo
- family of statistical tests that quantify the relationship between the variables….
Correlation coefficient what the heck is that?
single # that summarizes the relationship of two variables.. ranges from +1.00 to - 1.00 L> signs only indicate direction….both are equally as strong correlations
Characteristics of Correlation coefficient? most common correlation coefficient values?
- zero = very weak/ no relationship - + correlation = with every one unit increase there is a proportional increase in another variable..and vise versa - -0.5- + 0.5
Describe the Pearson r Correlation Coefficient.. how does it get around the issue of varying units?
- extent that paired scores occupy the same or opposite positions within their distributions…. - convert data into z score…so no unit score issue…
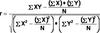
What is the raw score Pearson r Formula?? What does each part represent?
Variability of Y can be explained by?
- X
When r= 0 the best predictor of Y is the _____ of the y scores.. What are the erros associated with this?
- mean, imperfection in prediction…
When r does not equal 0 the best predictor of Y is ____. Prediction errors?
- X
- when x is a predictor the error goes down significantly
The total deviation of score is divisible into two parts..what are they?
- the distance from the regression line to the mean line = deviation accounted for by X (A)
- The distance from the regression line to the point in question….prediction error (B)
A+B= deviation of score
The deviation of Yi
is what??
prediction error + deviation of Yi accounted for by X
The total variablilty of Y ?
Variability of prediction errors + variability of Y accounted for by x
When correlation goes up the variability of prediction errors goes _____, variability of Y accounted for by Y _____.
-decreases, increases
When r= 0 the variability of P.errors = ________. Variability of Y accounted for x =___?
-min variable, none
When r= 1.00 Variability of P.errors = _____ and the variability of Y accounted for by x ____.
The greater x is = ___ proportion of Y is accounted for
- none, maximum
- greater
Explained variance? Explain it ! (4)
- r= correlation coefficient
L> magnitude and direction of relationship
- r = coefficient of determination
L>proportion of total variability in Y accounted for by x…
