What is overfitting?
The tendency of data mining procedures to tailor models to the training data at the expense of generalization to previously unseen data points
What is generalisation?
Is the property of a model or modeling process, whereby the model applies to data that were not used to build the model.
Goal is to build models that apply to the general population, and not just the training data.
Goal: build models that generalize beyond the training data.
What is a table model?
- The data for which the dependent variable is true is stored in a table and it is merely a memory of the training data.
- Remembers the training data but performs no generalization.
- When a new customer is added, the model will predict “0% likelihood of churning” since this customer is not included in the table.
- Useless model in practice.
Why is overfitting bad?
- Overfitting reduces the performance of the model because the model picks up spurious correlations that are idiosyncratic to the training set.
- These correlations do not represent characteristics of the general population
- Spurious correlations produce incorrect generalizations in the model
- Every sample is a subset of the general population: will have variations even when there is no bias in the sampling
- No general way to find out if model has overfitted
- Method to detect and measure overfitting: holdout set
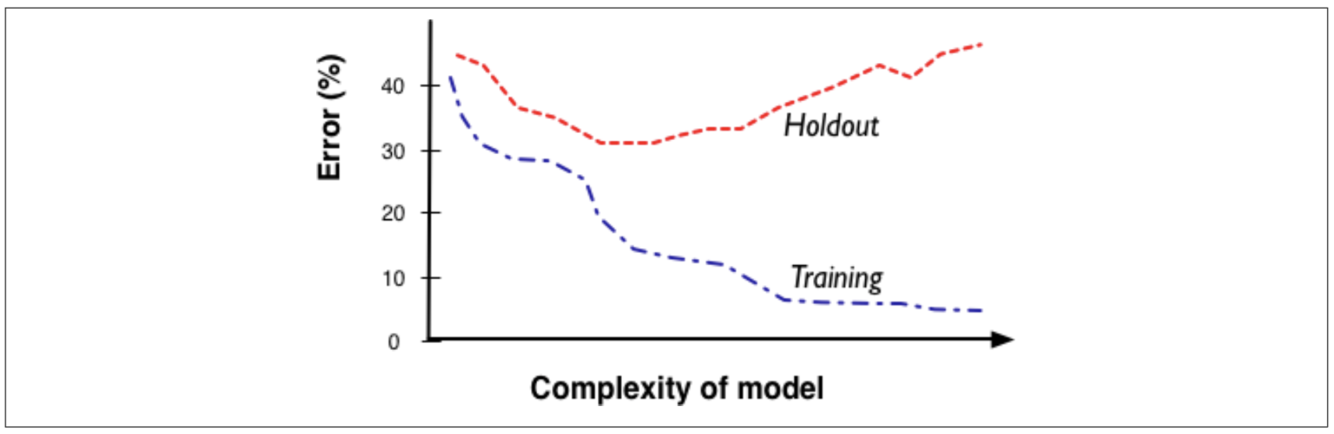
What is a fitting graph and why is it useful for overfitting analysis?
A graph that shows the accuracy of the model as a function of complexity.
The fitting graph shows the difference between a modeling procedure’s accuracy on the training data and the accuracy on holdout data as model complexity changes. Generally, there will be more overfitting as one allows the model to be more complex.
What is the base rate?
A classifier that always selects the majority class is called a base rate classifier.
In other words, it is referring to the table model. Since the table model always predicts no churn for every new case with which it is presented, it will get every no churn case right and every churn case wrong. (not sure about this)
Overfitting in Classification tree / Tree induction
- Once leaves are pure, the tree overfits, meaning it acquires details of the training set that are not characteristic of the population in general
- This means the model tends to generalize from fewer and fewer data points (at each leave)
- Overfit classification trees can generalize better than table models, because every new instance will get a classification (table model: new obs. fail to be matched entirely, error rate = very high)
- The complexity of the tree depends on the number of nodes
- Perfect number of nodes is a trade-off between:
- Not splitting data at all
- Building a complex tree with only pure leaves
What is the overfitting in mathematical functions?
- Mathematical functions can overfit if you add more attributes and thus increase the dimensions.
- Selection of attributes increasingly cannot be done manually (1000s of attributes to choose from)
- As you increase the dimensionality you can perfectly fit larger sets of arbitrary points
- The more attributes a function has, the more leeway does the modeling procedure have to fit the training set
- With more flexibility (attributes) comes more overfitting
What is the overfitting in linear functions SVM and Logistic regression?
- Logistic regression function
- will always find a boundary if it exists, even if that means moving the boundary to accommodate outliers
- If one observation changes the linear boundary strongly, it indicates overfitting
- One observation should not have an impact on a large dataset.
- SVM
- Less sensitive to individual examples
- In SVM, to avoid overfitting, we choose a Soft Margin, instead of a Hard one i.e. we let some data points enter our margin intentionally (but we still penalize it) so that our classifier don’t overfit on our training sample.
- Reason for less overfitting: training procedure incorporates complexity controls
- one way: regularisation
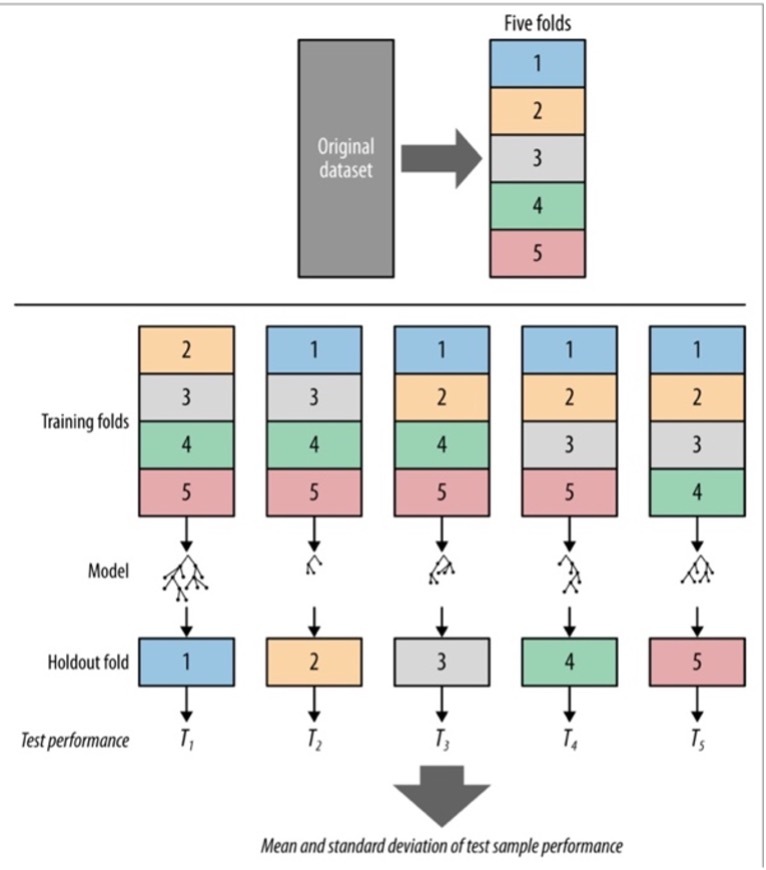
What is cross validation?
- A more sophisticated holdout training and testing procedure
- Computes its estimates over all the data by performing multiple splits and systematically swapping out samples for testing
- Also calculates statistics on the performance (e.g. mean, variance)
- First step in cross-validation is to split the dataset into k partitions called folds
- Typical numbers for k= 5 or 10
- The training and testing is iterated k times
- Purpose of cross-validation is to use the original labeled data efficiently to estimate the performance of a modeling procedure
- Application: can be performed on both, trees & logistic regressions
What is holdout data?
- Test set / lab model to evaluate generalization performance
- Data for which the target value is known, but which will not be used to build the model
- “Hold out some of the data for which we know the target variable” (20% = testing data)
- Test the model with the so called “training data”
- Holdout sets only provide a single estimate of generalization performance
- Good performance might be due to chance: apply cross-validation
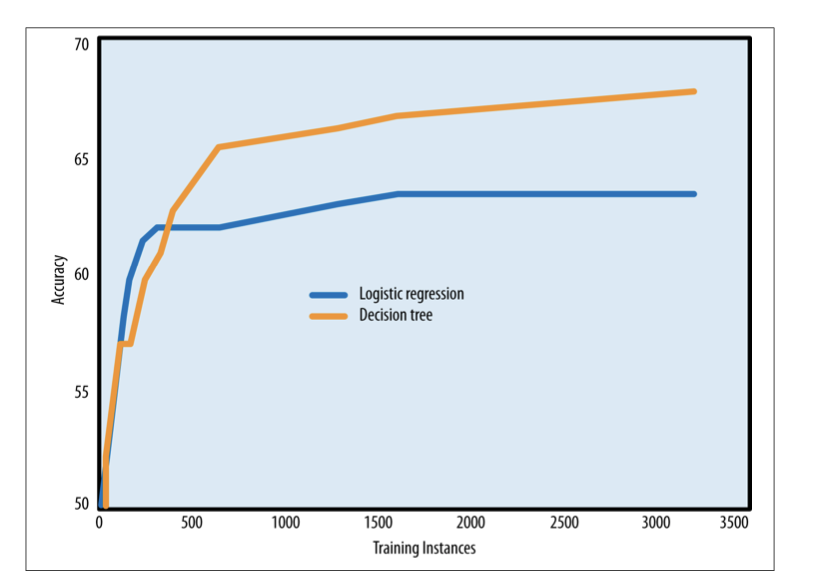
What is a learning curve?
- A plot of the generalization performance (accuracy) vs the amount of training data (no. instances)
- Usually steep in the beginning: model finds most apparent regularities in the data
- Flattens out: but the marginal advantage of having more data decreases at some point
What is the difference between a fitting graph a learning curve?
Learning curves shows the generalization performance – the performance only on testing data, plotted against the amount of training data used.
Fitting graphs show the generalization performance as well as the performance on the training data plotted against model complexity.
Generally shown for a fixed amount of training data
How do the learning curves of classification trees and logistic regression compare?
Given the same set of features, classification trees are a more flexible model representation than linear regression
- For smaller datasets
- tree induction will tend to overfit more
- logistic regressions tend to perform better
- For larger datasets
- Tree induction often the better choice (less overfitting): represent substantially better nonlinear relationships between the features and the target.
How can you mitigate/avoid overfitting in tree induction?
- Stop growing the tree before it gets too complex (i.e. “too pure”) by:
- Specifying a minimum number of instances
- Hypothesis testing at every leaf (p-value)
- Pruning too large tree
- Minimum / simplest method: specify a minimum number of instances that must be present in a leaf
- Tree induction will automatically grow the tree branches that have a lot of data and cut short those that have fewer data
- Pruning: Grow the tree until it is too large and then prune it back, reducing its size: cutting off leaves and branches and replacing them with leaves
- Test if replacing a set of leaves reduces accuracy in order to make decision
- Hypothesis testing: Alternative approach is to conduct a hypothesis test at every leaf to determine whether the observed difference in e.g. information gain could have been due to chance
- If null hypothesis is rejected, the tree growing continues
What is nested holdout testing?
- Splitting the training set again into
- training subset and
- testing subset
- Build a model with the training subset
- Compare models using the testing subset
- It is nested because a second holdout procedure is performed on the training set selected by the first holdout procedure
- General procedure is to choose the value for some complexity parameter by using a sort of nested holdout procedure
- Nested cross-validation → For each fold you run a separate sub-cross-validation first to find the complexity parameter C
- Before building the model for each fold, you run an entire cross-validation on just the training set to find the value of C that gives the best accuracy
- Result is used to set C in the actual model for that fold of the cross validation
- Then another model is built using the entire training fold using that value for C and is tested on the corresponding test fold
What is Sequential Forward Selection (SFS)?
What is Sequential Backward Elimination?
Sequential forward selection (SFS) → a nested holdout procedure to first pick the best individual feature, by looking at all models built using just one feature. After choosing the first feature, SFS tests all models by adding a second feature and so on. It adds one feature at a time until newly added features do not increase accuracy.
Process ends when adding a feature does not improve classification accuracy.
Sequential backward elimination of features works by starting with all features and discarding features one at a time. It continues to discard features as long as there is no performance loss.
What is nested cross-validation?
Nested cross-validation → For each fold you run a separate sub-cross-validation first to find the complexity parameter C
Before building the model for each fold, you run an entire cross-validation on just the training set to find the value of C that gives the best accuracy
Result is used to set C in the actual model for that fold of the cross validation
Then another model is built using the entire training fold using that value for C and is tested on the corresponding test fold
The only difference from regular cross-validation is that for each fold we first run this experiment to find C, using another, smaller, cross-validation.
Why do decision trees overfit? and logistic-regression or SVM? How can you counteract overfitting?
If unbounded, 100% accuracy is possible with decision trees as it continues to make the leaves more specific, based on smaller sets of data. Thereby learning dataset specific patterns that don’t generalies across a population.
Logistic regression finds a dividing hyperplane if there is one. If it has too many degrees of freedom it can easily fit the training data.
SVM overfits for the same reason, when it has too many free variables/dimensions.
You can counteract overfitting by reducing model complexity or increase complexity while measuring accuracy on a train and holdout set and stopping when accuracy starts to diverge. For trees specify a minimum number of instances that must be present in a leaf. The second strategy for trees is ‘pruning’, which is cut off leaves and branches, replacing them with leaves. You could also use hypothesis testing to test whether the observed difference was due to chance. More generally, culling feature sets. Also, regularisation.
In k-fold cross validation, what is the maximum amount of k-folds that can be used? In what cases would this strategy be useful?
The amount of data points you have. It is useful for smaller datasets. When it is too costly to gather more data. Called leave-one-out cross-validation.
The maximum amount of folds is the same as the number of observations and this is called leave-one-out cross-validation (LOOCV). LOOCV provides an unbiased estimation of the test error, but it also increases variability, since it is based in a single observation. This strategy is useful in cases where we have a natural limited amount of data, such as rare medical conditions.
How can cross validation and fitting graphs help in checking for over-fitting?
Cross validation provides a better understanding of the generalisation accuracy. Fitting graphs can help you find the sweet spot in terms of complexity.
Combined, using cross validation to compute the accuracy used in your fitting graph you can be more certain that the outcome is valid. Doing so results in a fitting graph that includes a confidence interval.
Explain in detail the steps to build a fitting graph for a decision tree and for a logistic regression classification model.
In a decision tree parametrise the complexity of the tree as the amount of nodes or the depth of the tree.
Repeat until satisfied overfitting:
- Generate tree up to depth
- Compute training & validation accuracy
- Increase depth
For logistic regression the same applies just not with depth or nodes, rather using the amount of variables it is allowed to use.
Sketch a learning curve for a decision tree with holdout and training.
In Session 4’s Assignemnt:
If you were to create a new classification tree based on information from Table 2,
could you then test/validate with the data on Table 1? Explain your reasoning.
Hint: : Check the ratio of digital subscriptions vs non-digital subscriptions.
No, the proportion with respect to the target variable varies significantly.
