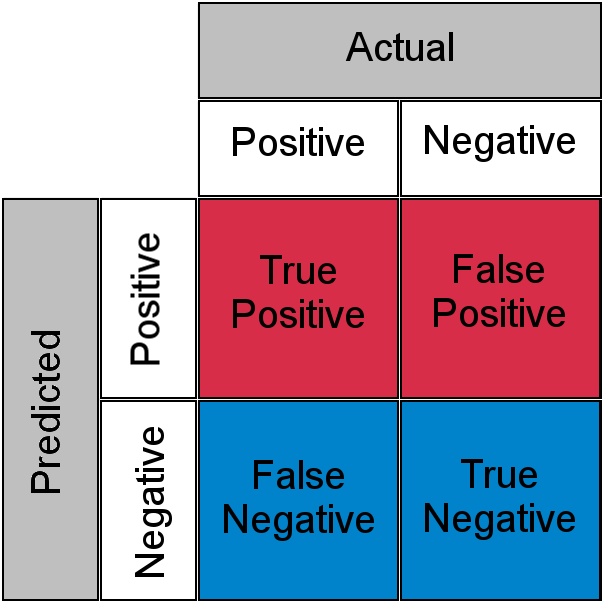
Where do False Positive rate and False Negative rate sit in the confusion matrix?
If you could only use the top 25% of instance which model would you go for?
If you could go for more?
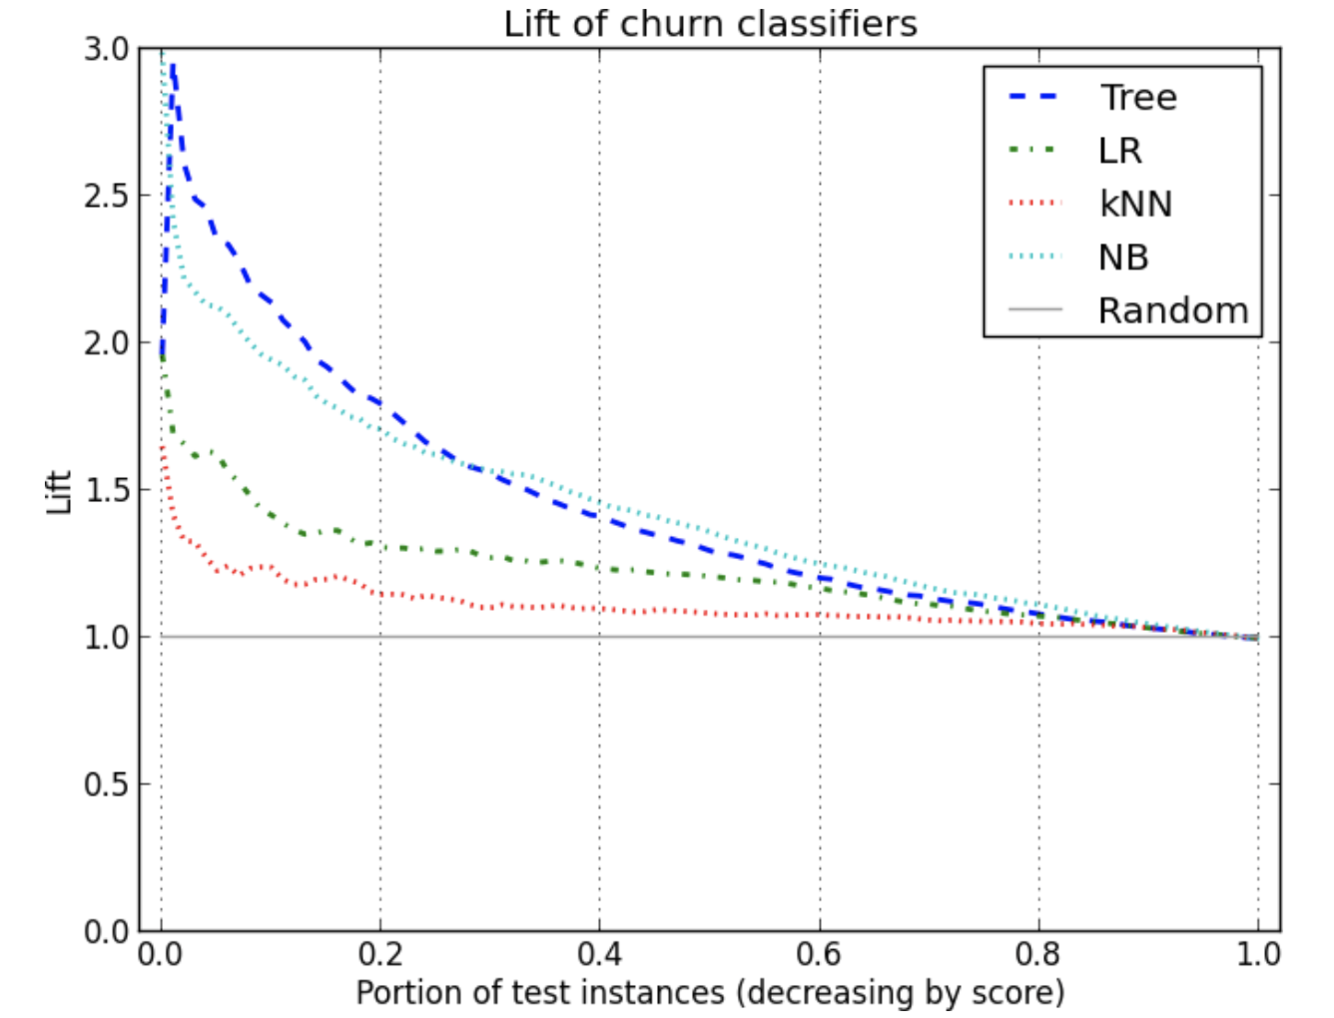
Looking at this graph, if you wanted to target the top 25% or less of customers, you’d choose the classification tree model; if you wanted to go further down the list you should choose NB.
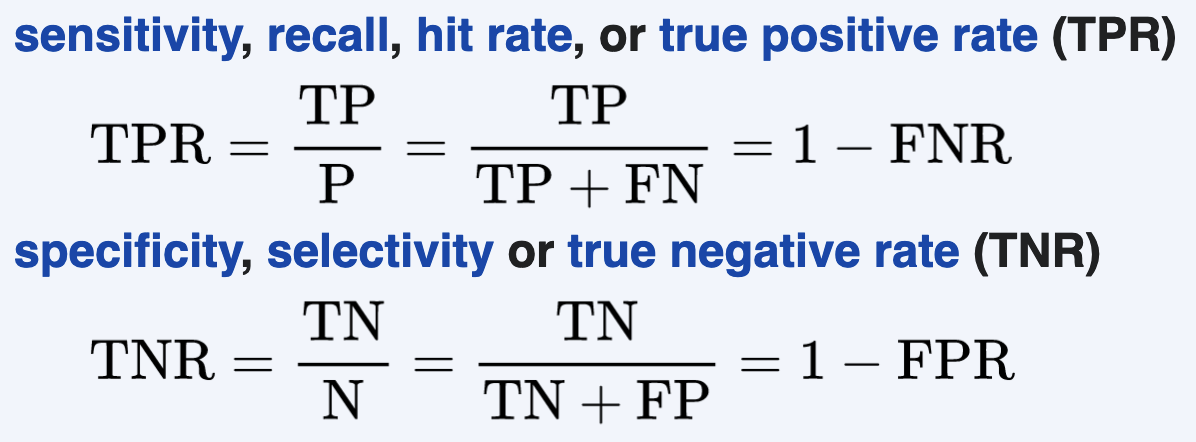
What are the equations for sensitivity and specificity?
How do you remember them?
Sensitivity refers to the true positive rate
Specificity refers to the true negative rate
Sensitivity, view it as how well it can detect true positives relative to positives that were actually indentified as negative (false negative)
false negative, in other words, it falsely assigned a negative.
What do ROC curves allow for?
ROC make it easy to indentify the best threshold to make a decision.
What does the AUC allow you to do?
The AUC can help you decide which categorisation method is better.
What should we know about ranking classifiers?
- Combining classifier (confusion matrix) + threshold.
- Setting of the threshold depends on whether classifier decisions should be.
- Conservative (higher threshold)
- Permissive (lower threshold)
- Every threshold produces a single confusion matrix.
- Lowering the threshold: cases move from pred. negative (p) to pred. positive (p)
- Threshold should be set so that expected profit is above a desired level (at least above 0).
What are profit curves and how do you choose a classifier?
- For each profit curve the customers are ordered from highest to lowest probability of accepting an offer based on some model
- Plotting expected profit on y-axis versus the percentage of training instances (decreasing by score)
- Profit can be negative
- All classifiers start and end at the same point, but maximum profit varies
Choosing a classifier:
- Maximize profit with unlimited budget: choose classifier with highest profit
- Choosing a classifier when having a constrained budget
- First calculate # of customer you can target
- Check the best performing model for # of customers
How do you build a profit curve and what the critical conditions for the suitability of a profit curve?
How do you build it?
- Each curve is based on the idea of examining the effect of thresholding the value of a classifier at successive points
- At each successive point the expected profit is calculated
Critical conditions of the suitability of profit curves
- The class priors – the proportion of positive and negative instances in the target population are known
- Aka base rate: positive / positive + negative
- The cost-benefit estimates are known and expected to be stable
What is a ROC curve and when is it used?
- Receiver Operating Characteristics (ROC): two-dimensional plot of classifiers
- Depicts the trade-off that a classifier makes between benefits and costs
- X-axis: False positives = costs
- Y-axis: True positives = benefits
- Only actual positive and negative examples are considered
- It used when class priors and cost-benefit estimates are not known well. (opposite to profit curves)
- Each classifier produces a confusion matrix corresponding to a single point in the ROC.
- Only need two values of the confusion matrix not all 4 ratios (e.g. TP and FP)
What are important points in the ROC space?
- Point (0,0) represents the strategy of never issuing a positive classification
- Point (1,1) represents the strategy of classifying everyone as positive
- Point (0,1) represents perfect classification
- Diagonal line connecting (0,0) and (1,1) represents the policy of guessing a class
How do you evaluate points in a ROC curve?
Which side is more important?
- One point in ROC space is superior to another if it is to the northwest of the first
- Classifiers that are below the line of random guessing perform worse that random guessing
- Conservative: classifiers on the left-hand side of ROC graph, near the x-axis
- TP-rate is medium (high certainty & evidence), but few overall
- FP-rate is low
- Permissive: classifiers on the upper-righthand side of ROC graph
- Make positive classifications with weak evidence
- TP-rate is high: all positives are correctly classified positively
- FP-rate is high: because nearly all observations are classified positively, although not the case
- Many real-world domains dominated by a lot of negative instances
- Performance on far left-hand side more important: cancer detection
When thinking about ranking classifiers, for logistic regression, what does the threshold translate to?
The threshold translates to the probabilty scale on the y-axis of the sigmoid plot.
How is a ranking model with a threshold applied to a ROC curve?
If classifier value is above threshold, above upward (TP)
If classifier value is below threshold, move right (FP)
What is the AUC?
- Summary statistic indicating the area under a classifier’s curve expressed as a fraction of the unit square
- Good summary statistic of the predictiveness of a classifier
- Good summary statistic if nothing is known about the operating conditions
- Values range from 0 to 1
- 0.5: to randomness
- 1: perfect in distinguishing between positives and negatives
- Better than accuracy as a performance measure if datasets are skewed
What do want to see in a Cumulative Response curve?
Plots percentage of positives targeted against the percentage of test instances.
What we want to see is that if target 20% of the population well find more than 20% of our positive cases.
What can we calculate/derive from the cumulative response curve?
We can calculate Lift, which is the advantage the model gives us over the baseline at a given percentage targeted, by dividing the percentage of positive targeted by the percentage of total instances seen. Lift tells us what sort of advantge the model gives us over baseline.
Lift should be above 1 to outperforn baseline.
What is the Cumulative Response Curve?
- Plots how % of positive targeted changes for percentage of population targeted
- X-axis: hit rate (true positive)
- Y-axis: percentage of the population that is targeted (from ranked list)
- Diagonal line represents random performance
- Any classifier above the diagonal line is good
- Moving down the list of ranked instances we increasingly target a larger population
- Functioning model: first instances will have high TP rate > TN rate
What is the Lift curve?
Lift: amount by which a classifier concentrates the positive examples above the negative examples
How much more prevalent is the positive class in the selected sub-population over the distribution of the class in the entire population? E.g. if the prevalence of target class A is 1% in the entire population and in our sub-population it is 5% we have a corresponding lift of 5!
What are important things to consider about cumulative reponse and lift curves?
- Cumulative response curve & lift curve
- Use with care if the exact proportion of positives is not known or not presented accurately
- Curves assume that test set has exactly the same target class proportion as the population to which it will be applied (e.g. the general population)
- This isn’t the case for ROC curves. So ROC differe here too.
- Lift curves are sensitive to the class proportions, if the ratio changes the curves change as well
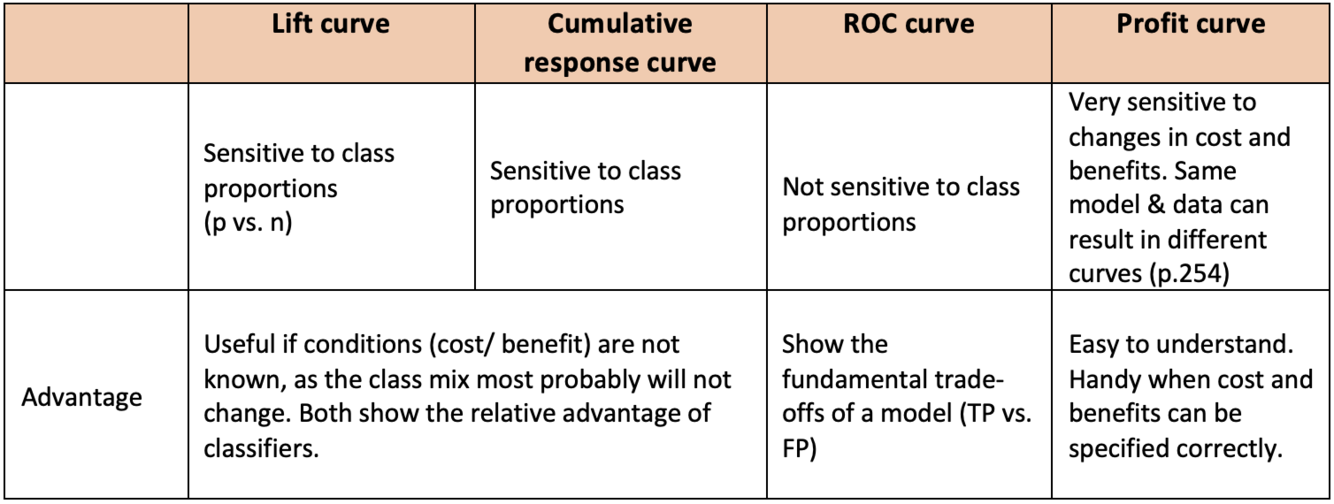
What are all the graphs/plots individually sensitive to and on the other hand what are advantages?
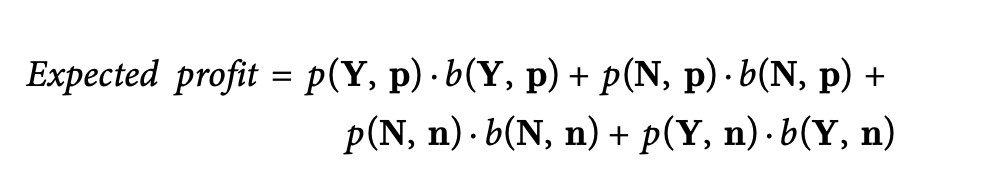
What equation do you need to calculate the profit curve?
The expecterd profit equation.
You can also use the modified version with conditionals.